

 Documentaries and Tutorials
| Home» Mumbai Massacre Torahcode Experiments |
Mumbai Massacre Torahcode Experiment Analysis
Our first analysis summary is to examine the p-values for the best tables in each category class. The structure of our analysis is that of the lattice formed by these category classes. These are shown in the lattice diagrams below.
Taj Mahal
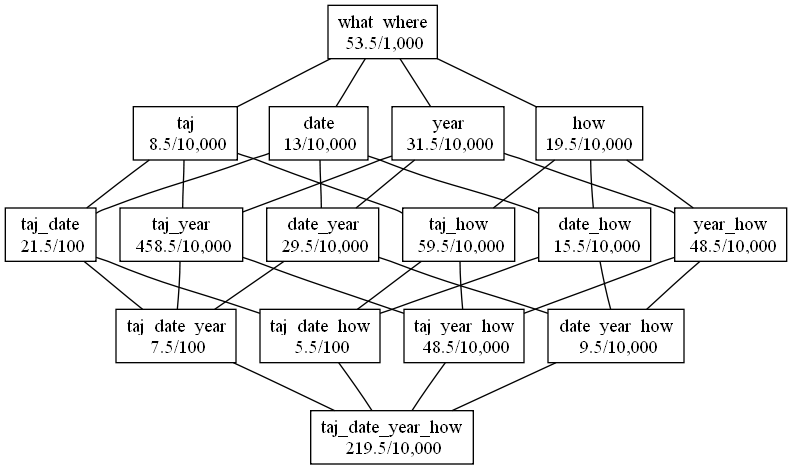
The Category lattice and p-values with the Who category taking the value of Taj Mahal.
Oberoi
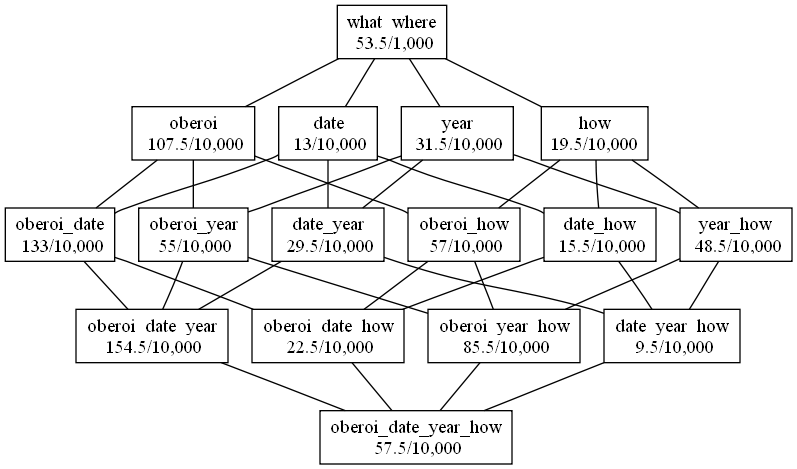
The Category lattice and p-values with the Who category taking the value of Oberoi.
Chabad
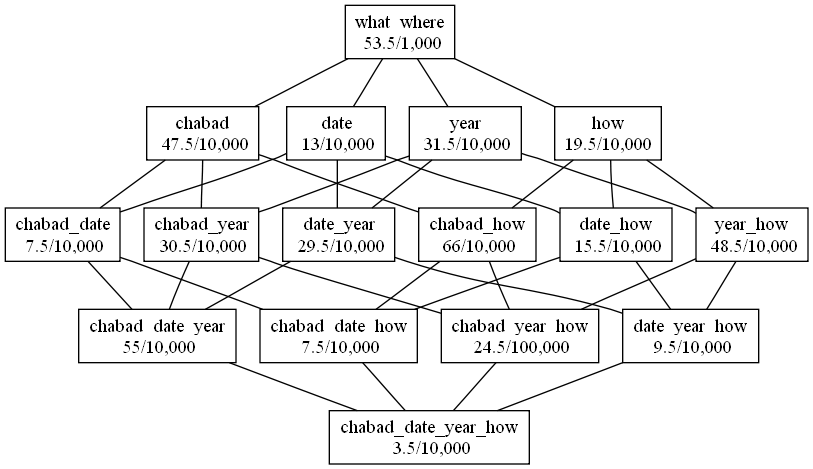
The Category lattice and p-values with the Who category taking the value of Chabad.
Category Hebrew Keyword Lists
| Category | # Key Words | Key Words |
|---|---|---|
| What | 5 | טבח, הטבח, טרור, הטרור, טבח טרר |
| Where | 6 | מומבאי, מומביי, במומבאי, במומביי, בומבי, בבומבי; הודו |
| Who Taj Mahal | 1 | טאג מהאל |
| Who Oberoi | 1 | אוברוי |
| Who Chabad | 3 | נארימן, בית נארימן, בית חבד |
| When Date | 2 | כט חשון, בכט חשון |
| When Year | 4 | התשסט, בהתשסט, תשסט, בתשסט |
| How | 6 | רוצחים, רצחים, מחבלים, איסלם, אסלם, מוסלמים |
We now show the p-value by combined category information augmented by the number of experiments performed in the combined category.
P-values
| Category | P-value | # Experiments | |
|---|---|---|---|
| 0 | What Where | 53.5/1,000 | 30 |
| 1 | Who Taj Mahal | 8.5/10,000 | 30 |
| 1 | Who Oberoi | 107.5/10,000 | 30 |
| 1 | Who Chabad | 47.5/10,000 | 90 |
| 2 | When Date | 13/10,000 | 60 |
| 3 | When Year | 31.5/10,000 | 120 |
| 4 | How | 19.5/10,000 | 180 |
| 5 | Who Taj Mahal When Date | 21.5/100 | 60 |
| 5 | Who Oberoi When Date | 133/10,000 | 60 |
| 5 | Who Chabad When Date | 7.5/10,000 | 180 |
| 6 | Who Taj Mahal When Year | 458.5/10,000 | 120 |
| 6 | Who Oberoi When Year | 55/10,000 | 120 |
| 6 | Who Chabad When Year | 30.5/10,000 | 360 |
| 7 | Who Taj Mahal How | 59.5/10,000 | 240 |
| 7 | Who Oberoi How | 57/10,000 | 240 |
| 7 | Who Chabad How | 66/10,000 | 720 |
| 8 | When Date Year | 29.5/10,000 | 240 |
| 9 | When Date How | 15.5/10,000 | 360 |
| 10 | When Year How | 48.5/10,000 | 720 |
| 11 | Who Taj Mahal When Date Year | 7.5/100 | 240 |
| 11 | Who Oberoi When Date Year | 154.5/10,000 | 240 |
| 11 | Who Chabad When Date Year | 55/10,000 | 720 |
| 12 | Who Taj Mahal When Date How | 5.5/100 | 360 |
| 12 | Who Oberoi When Date How | 22.5/10,000 | 360 |
| 12 | Who Chabad When Date How | 7.5/10,000 | 1080 |
| 13 | Who Taj Mahal When Year How | 48.5/10,000 | 720 |
| 13 | Who Oberoi When Year How | 85.5/10,000 | 720 |
| 13 | Who Chabad When Year How | 24.5/100,000 | 2160 |
| 14 | When Date Year How | 9.5/10,000 | 1440 |
| 15 | Who Taj Mahal When Date Year How | 219.5/10,000 | 1440 |
| 15 | Who Oberoi When Date Year How | 57.5/10,000 | 1440 |
| 15 | Who Chabad When Date Year How | 3.5/10,000 | 4320 |
Yet to be done is to evaluate all the sub-experimental results by means of a Torah code lattice methodology to obtain one overall p-value for the entire experiment.